


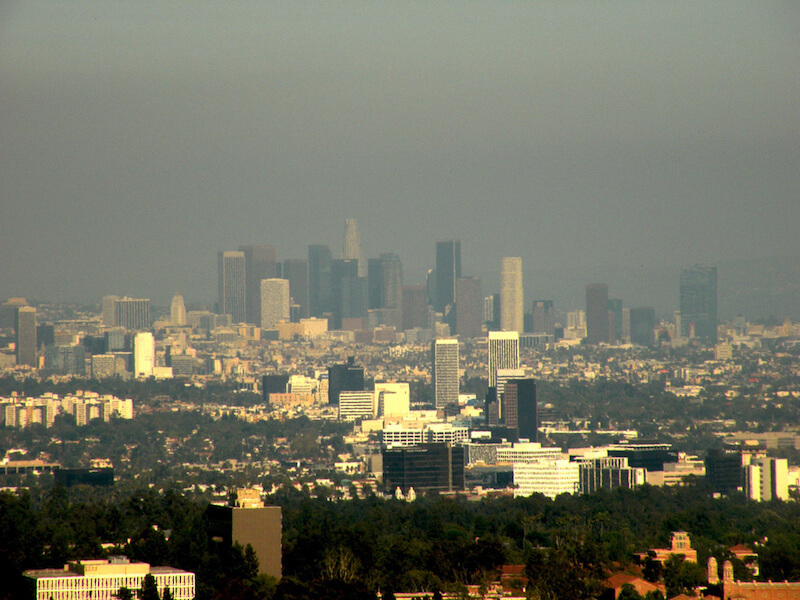
A photograph showing smog over downtown Los Angeles. Credit: Public Domain
Air quality is a measure of how clean or polluted the air is. Monitoring air quality is important because polluted air can be bad for our health—and the health of the environment.
Air quality is measured with the Air Quality Index, or AQI. The AQI works sort of like a thermometer that runs from 0 to 500 degrees. However, instead of showing changes in the temperature, the AQI is a way of showing changes in the amount of pollution in the air.
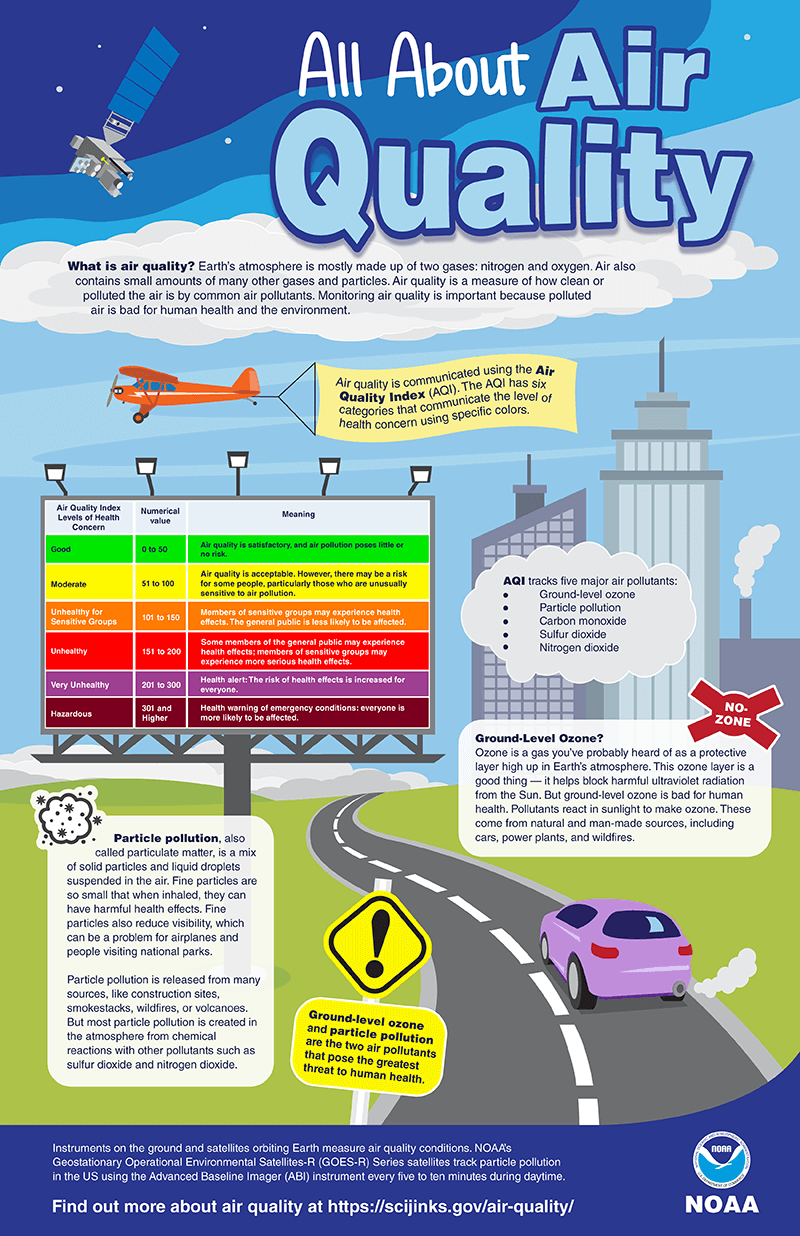
Click here to download the "All About Air Quality" poster! Credit: NOAA/JPL
What is in the air?
The air in our atmosphere is mostly made up of two gases that are essential for life on Earth: nitrogen and oxygen. However, the air also contains smaller amounts of many other gases and particles. AQI tracks five major air pollutants:
- Ground level ozone
- Carbon monoxide
- Sulfur dioxide
- Nitrogen dioxide
- Airborne particles, or aerosols
Ground level ozone and airborne particles are the two air pollutants that pose the greatest risk to human health in the United States. They are also the two of the main ingredients in smog, a type of air pollution that reduces visibility.
What are some things that cause bad air quality?
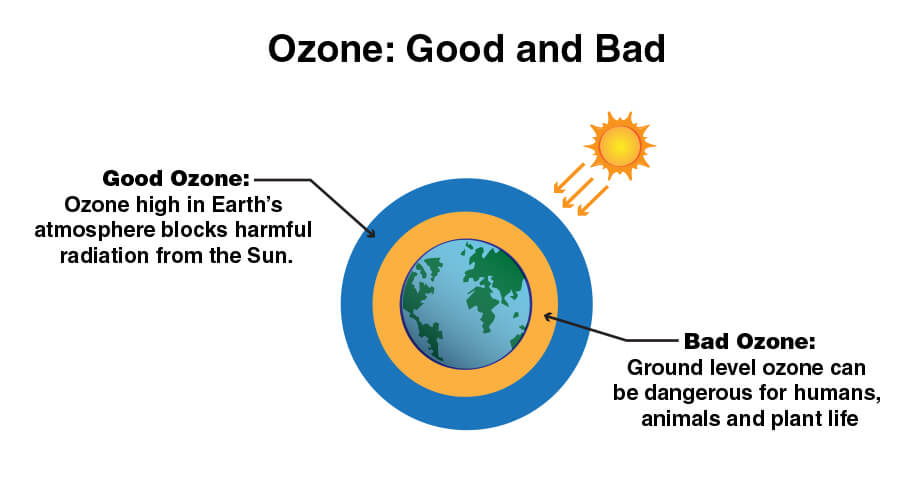
Ozone is a gas you’ve probably heard of as a layer high up in Earth’s atmosphere. This ozone layer is a good thing—it helps block us from the Sun’s harmful radiation. However, ground level ozone is bad for human health. It is created when sunlight reacts with certain chemical emissions (for example nitrogen dioxide, carbon monoxide and methane). These chemicals can come from industrial facilities, car exhaust, gasoline vapors and other sources.
Airborne particles are solid and liquid droplets suspended in the air. These particles become airborne at construction sites, smokestacks, car exhaust pipes, wildfires, volcanoes and many other places, too. The particles can also be formed from chemical reactions in the atmosphere.
How is air quality communicated?
Air quality is reported using the Air Quality Index (AQI). The AQI has six categories that communicate the level of health concern using specific colors. Code Green and Yellow means the air is generally safe for everyone. Code Orange is unhealthy for sensitive groups, including children, senior citizens, and people with heart and lung diseases. Code Red and Purple means the air is unhealthy for everyone, and Code Maroon is a health warning of emergency conditions.
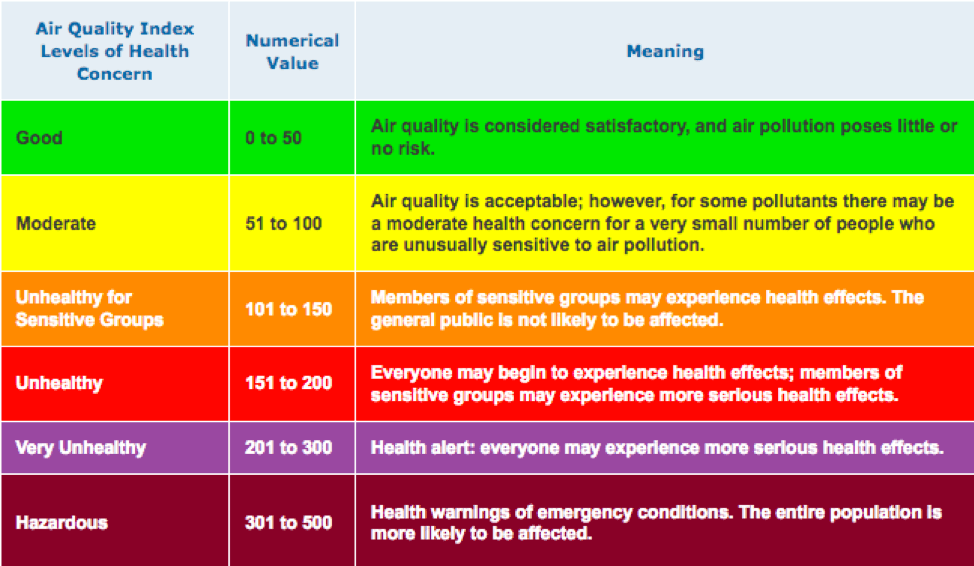
Air quality is measured in Air Quality Index values. Source: Airnow.gov
Where does information about air quality come from?
Instruments on the ground and satellites orbiting Earth collect information about what is in our air. For example, satellites in NOAA’s GOES-R (short for Geostationary Operational Environmental Satellites-R) Series monitor the particle pollution in our atmosphere.
The Joint Polar Satellite System (JPSS) also collects information about particles in our air. These particles include smoke particles from wildfires; airborne dust during dust and sand storms; urban and industrial pollution; and ash from erupting volcanoes. Ground level ozone can also be measured by the JPSS series of satellites.
GOES-R Series satellites can provide particle pollution measurements approximately every five minutes during the day. JPSS satellites can provide a higher resolution measurement of aerosols over the entire planet once a day. JPSS can also observe the movement of aerosols from one side of the planet to the other. JPSS can also measure carbon monoxide which is associated with poor air quality resulting from wildfires.
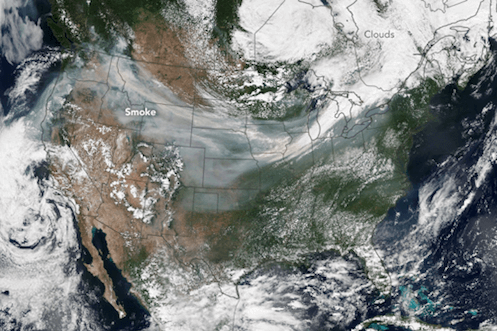
The image mosaic on the left of the slider bar shows visible smoke from wildfires on the West Coast of the blowing eastward across the United States. The image to the right of the slider bar shows the concentrations of airborne particles, or aerosols, from the fires that were swept west to east. Data from Suomi-NPP satellite, which is part of the JPSS system. Credit: NASA Earth Observatory/SSAI/SuomiNPP