Credit: NOAA/JPL
El Niño is a weather pattern that occurs in the Pacific Ocean, but it is so big that it affects weather all over the world.
Weather depends a lot on ocean temperatures. Where the ocean is warm, more clouds form, and more rain falls in that part of the world. In the Pacific Ocean, near the equator, the Sun makes the water especially warm on the surface.
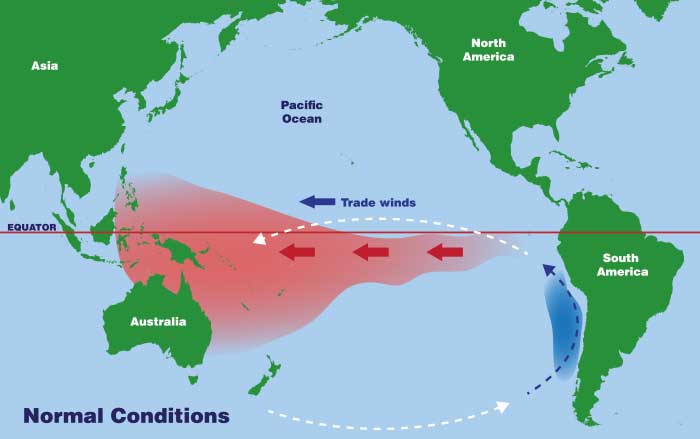
Normally, strong winds along the equator push the warm surface water near South America westward toward Indonesia. When this happens, the cooler water underneath rises up toward the surface of the ocean near South America.
Credit: NOAA/JPL
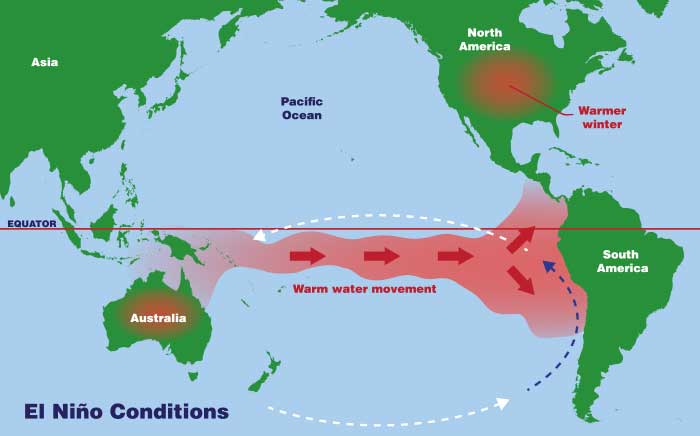
However, in the fall and winter of some years, these winds are much weaker than usual. They actually blow the other way (toward South America instead of Indonesia) in October. So the warm surface water along the equator piles up along the coast of South America and then moves north towards California and south toward Chile.
Credit: NOAA/JPL
Many fish that live in the normally cooler waters off the coast of South America move away or die. Fishermen first called this condition of warm coastal water and poor fishing "El Niño." El Niño means "the Christ Child." They call it that because it typically occurs at Christmastime.
In El Niño years, lots of rain clouds form over this warm part of the ocean. These clouds move inland and dump much more rain than usual in South and Central America and in the United States.
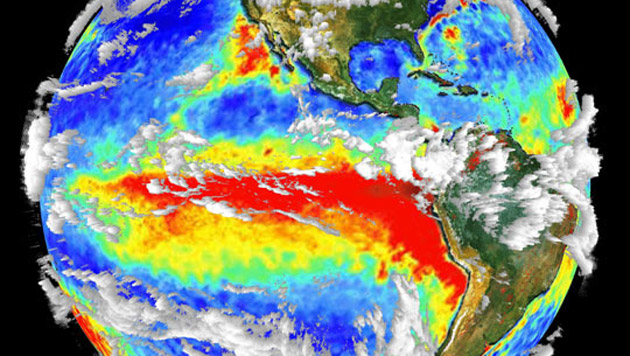
3-D cloud and surface temperature data are combined in this image from the Terra satellite, which shows a well-developed El Niño condition. The red area is warm water sitting off the coast of western South America.
Meanwhile, other parts of the world can suffer drought. Weather patterns all over the world may be unusual, making lakes out of deserts and charcoal heaps out of rain forests.
