


From Few Colors, Many Shades
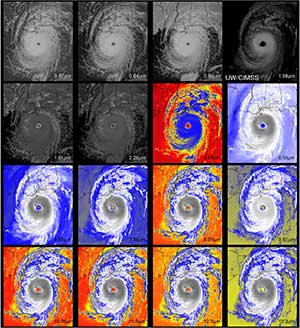
Scientists have simulated what the Advanced Baseline Imager would have seen of Hurricane Katrina in sixteen different slices, or bands, of light. Each of these images gives different information about the storm. Katrina hit the Gulf Coast in August 2005 causing huge damage. Credit: Cooperative Institute for Meteorological Satellite Studies (CIMSS)
You have six colors of paint: red, yellow, blue, green, black and white. Does this mean you cannot paint a pink pig or an orange sunset? Certainly not. A little white with your red will give you pink. And yellow with red gives you orange. The black and white together will give you every possible shade of gray. The possibilities are endless.
In a similar way, a few bits of information can be combined to create important new information. With the help of computers, scientists do this mixing quite a lot.
A group of satellites, called the GOES-R series, produce many types of information that are used to create lots of other information. (GOES-R stands for Geostationary Operational Environmental Satellite, R Series.)
One of six instruments on these weather satellites is the Advanced Baseline Imager. This imager captures 16 different images at a time of the same scene. To do this, it separates the light from the scene into 16 different slices, or bands. You can think of a “slice of light” as being like a crayon of a certain color. In this case, there are 16 crayons, not just six. Some of these slices of light are not even visible to us.
Why does the GOES-R imager slice up the light?
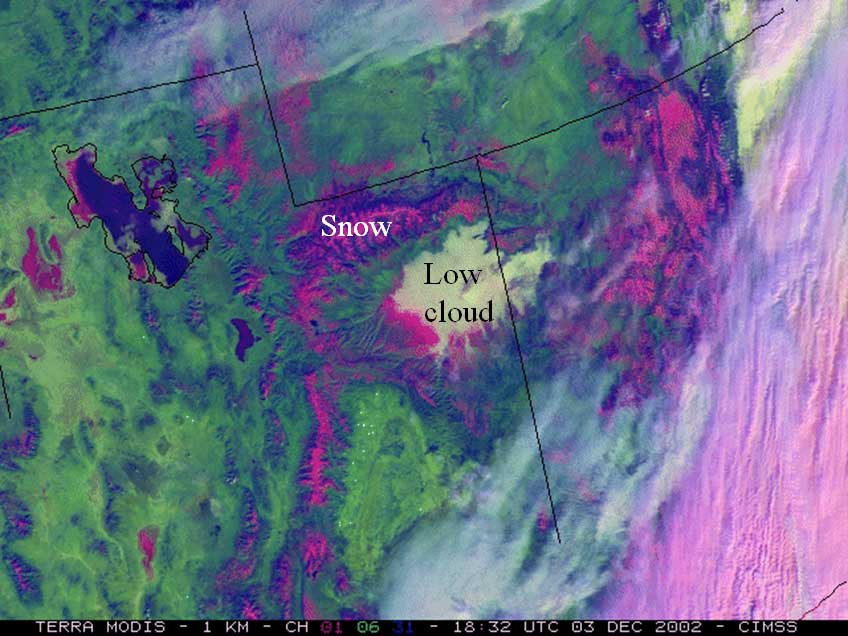
Three colors are used to show the data taken by an imager at three different wavelengths. (In this case, the imager was NASA's MODIS instrument.) Snow and low clouds look entirely different when the wavelengths are separated out like this. Credit: Scott Bachmeier, Cooperative Institute for Meteorological Satellite Studies (CIMSS) at the University of Wisconsin, Madison.
Different materials reflect (or emit) more of certain slices of sunlight than others. (Scientists call these slices “wavelengths” or “ranges of wavelengths.”) For example, to our eyes, snow and clouds would look similar from space. But a sensitive imaging instrument can see a tiny difference.
To see this difference, scientists use a special computer program to look at images in only the first six slices of the 16 “slices of light.” In this case, these are the slices that best reveal what is snow and what is cloud. From the computer program’s output, the scientist can then report to someone such as a water resource manager exactly how much of the ground is actually covered with snow. The water manager will then know how much fresh, clean water to expect from the melting snow in the spring.
Combining different bands from the imager's data gives all kinds of other information.
For example, clouds of volcanic ash can be made to stand out from ordinary clouds in the image. That way, airplane pilots can be warned not to fly near the ash clouds.
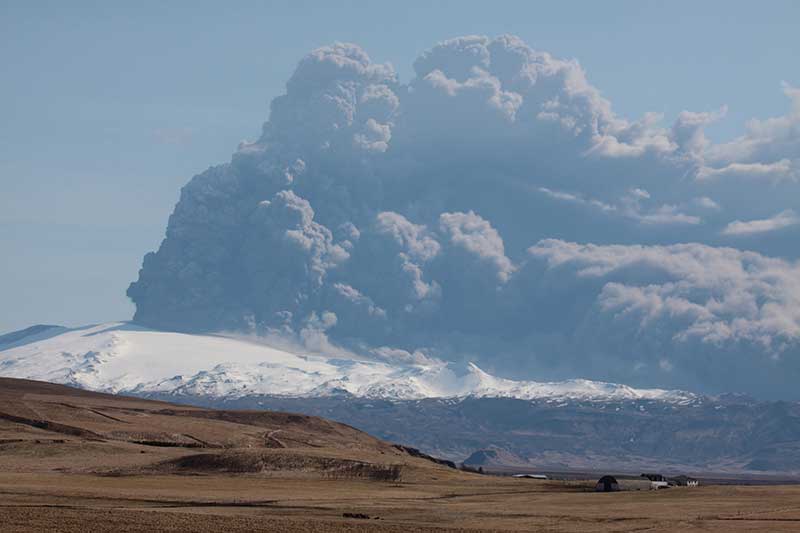
The eruption in 2011 of the Eyjafjallajokull volcano in Iceland caused many airlines to cancel flights. Credit: Boaworm via Wikimedia commons
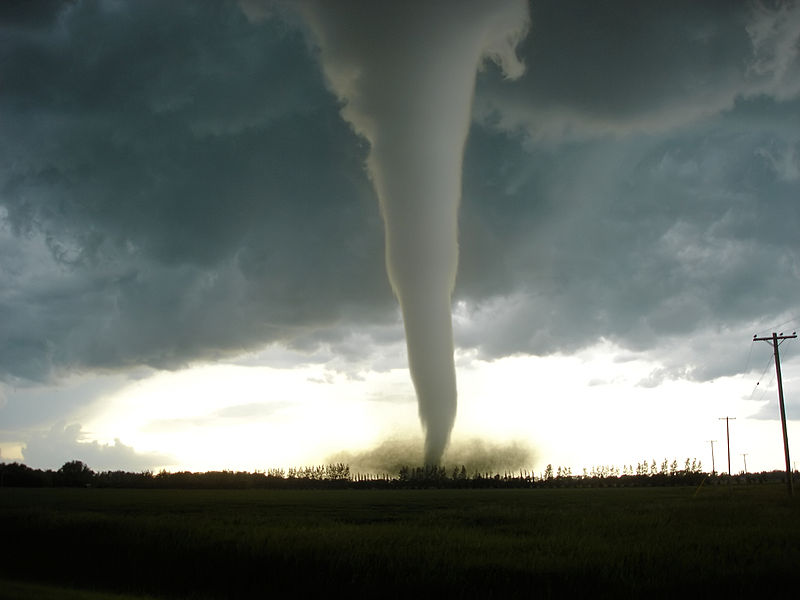
Tornado touches down in Elie, Manitoba. Credit Justin Hobson.
As another example, several different data combinations (called "data products") show cloud and storm conditions likely to produce tornadoes. It is important that forecasters be able to predict tornadoes accurately so that people will believe them and take shelter.