


"Hurricane Simulation" WebApp Courtesy of the Cooperative Institute for Meteorological Satellite Studies (CIMSS). Copyright 2013 by Tom Whittaker at the University of Wisconsin-Madison.
Explore the relationship between sea surface temperatures (SST) and hurricane strength.
How to build a hurricane:
- Drag the hurricane around to see the effect surface temperature has on the hurricane.
- Drag the grey high pressure area around to see how pressure and winds influence hurricane paths.
- Click the season name to rotate through seasons. Ocean temperatures change with each season.
- Click Reset to start over.
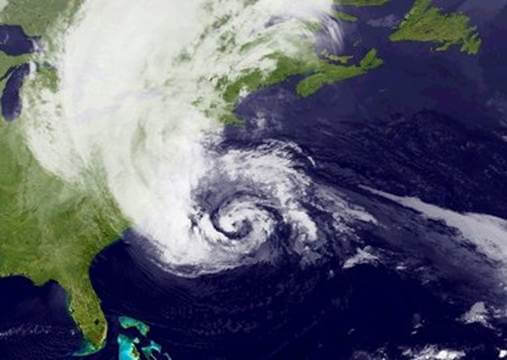
Hurricane Sandy from 2012. Credit:NOAA.
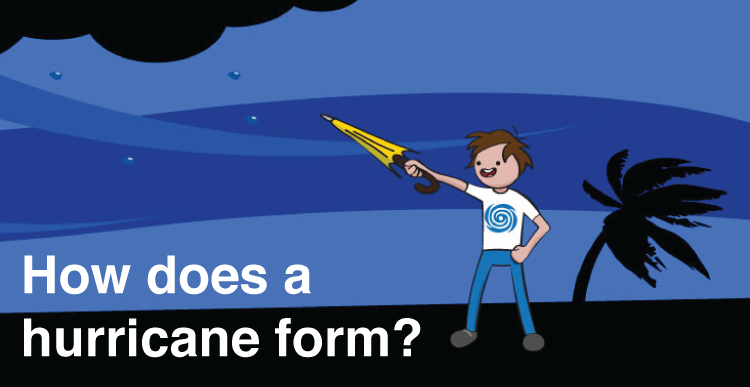
How big did your hurricane get? To find out how these tropical storms get started, click here to learn more about hurricanes.
What exactly do the numbers on the hurricane mean?
The hurricane in this simulation will either have an L on it, or be labelled with numbers 1 through 5. "L" stands for low pressure, and the numbers are the category of the hurricane:
Category |
Wind Speeds |
Extent of the Damage |
|
| 1 | 74-95 mph | Some damage to homes and trees. Power outages could last a few days. |
|
| 2 | 96-110 mph | Extensive damage to homes. Trees with shallow roots may be uprooted. Power outages could last for several days. |
|
| 3 | 111-129 mph | Devastating damage to well-built homes. Many trees are snapped or uprooted, blocking roads. |
|
| 4 | 130-156 mph | Catastrophic damage to homes. Most trees are snapped or uprooted. Power outages will last weeks or months. |
|
| 5 | 157 mph or higher | Seriously catastrophic damage. Homes are destroyed. The area will be uninhabitable for weeks or months. |
Source: NOAA National Hurricane Center
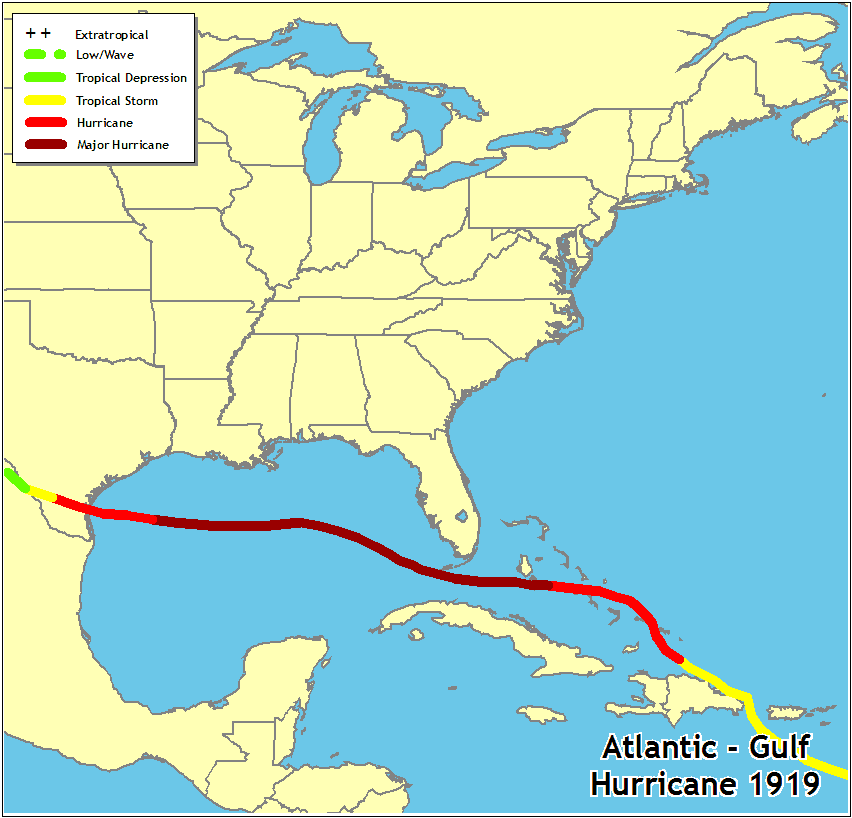
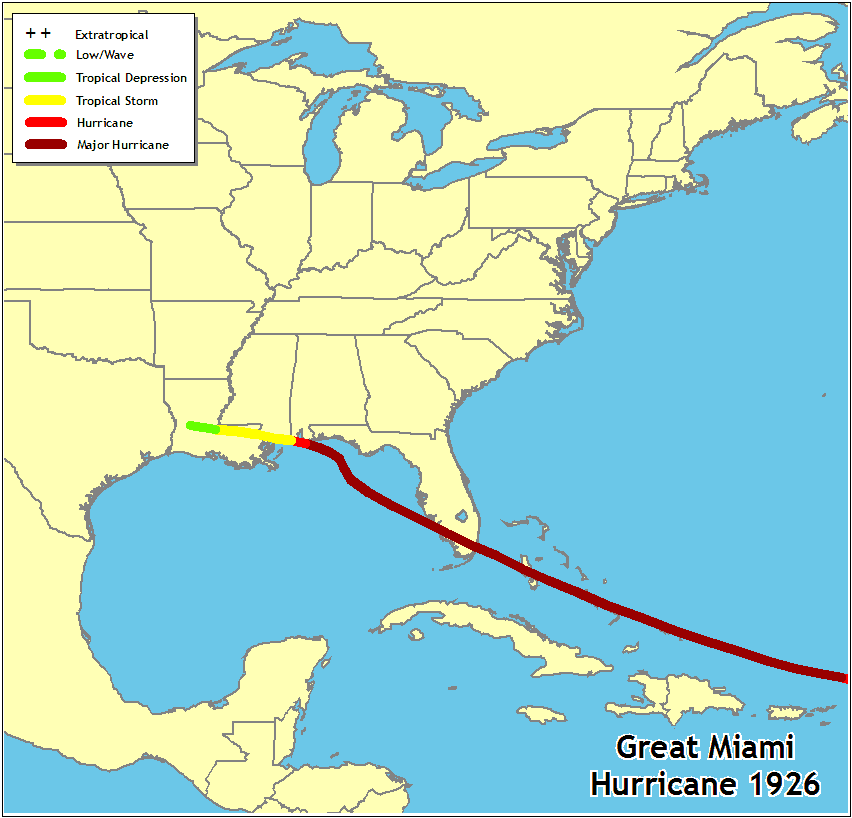
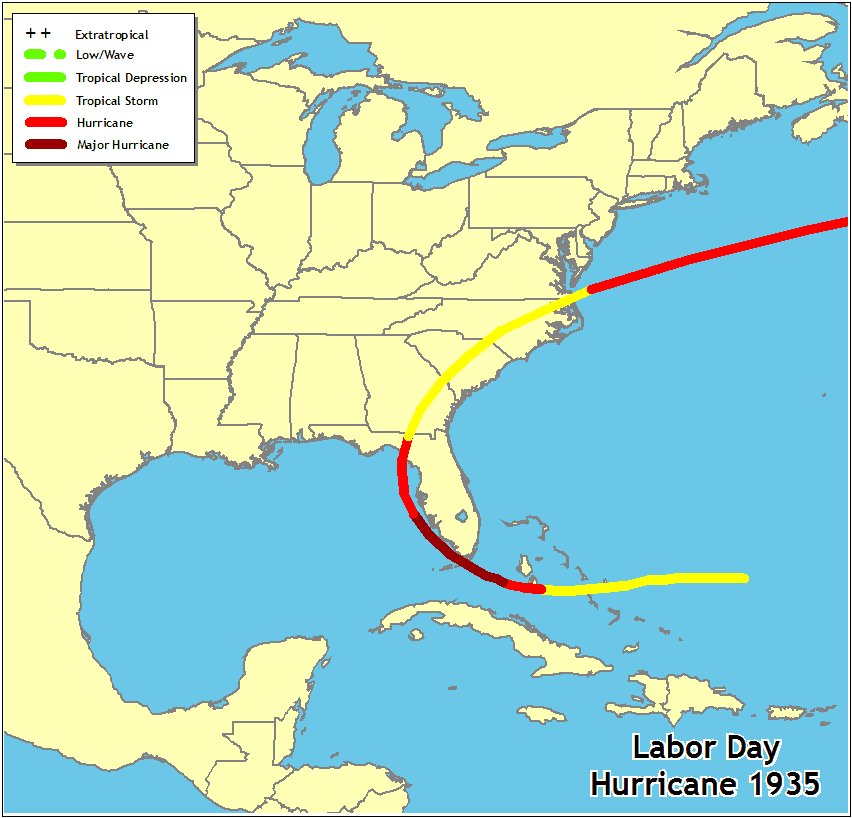
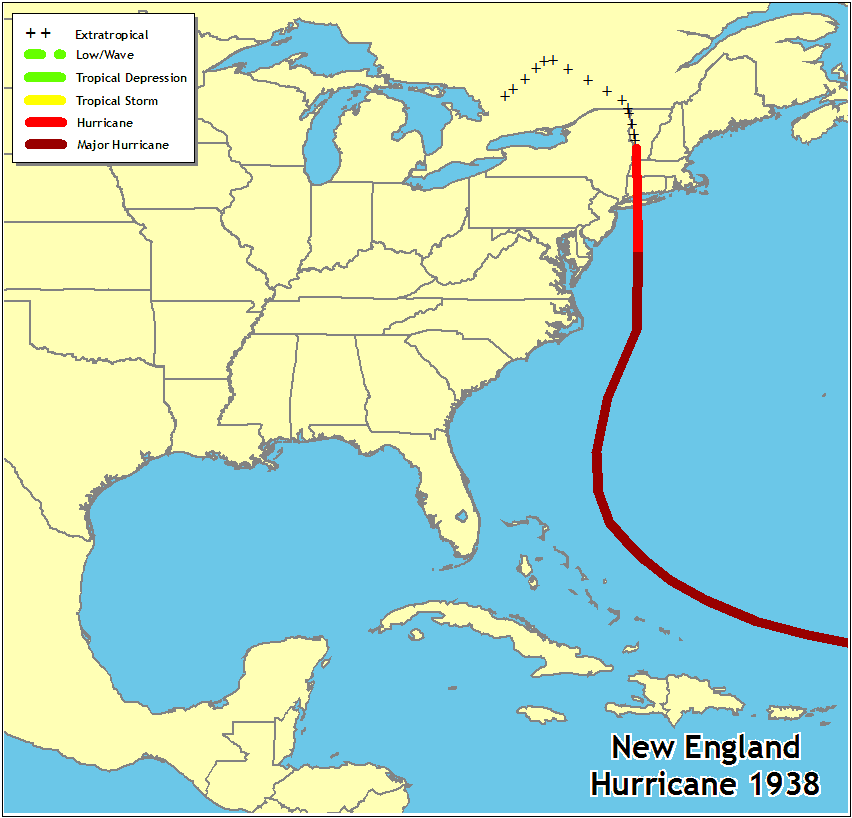
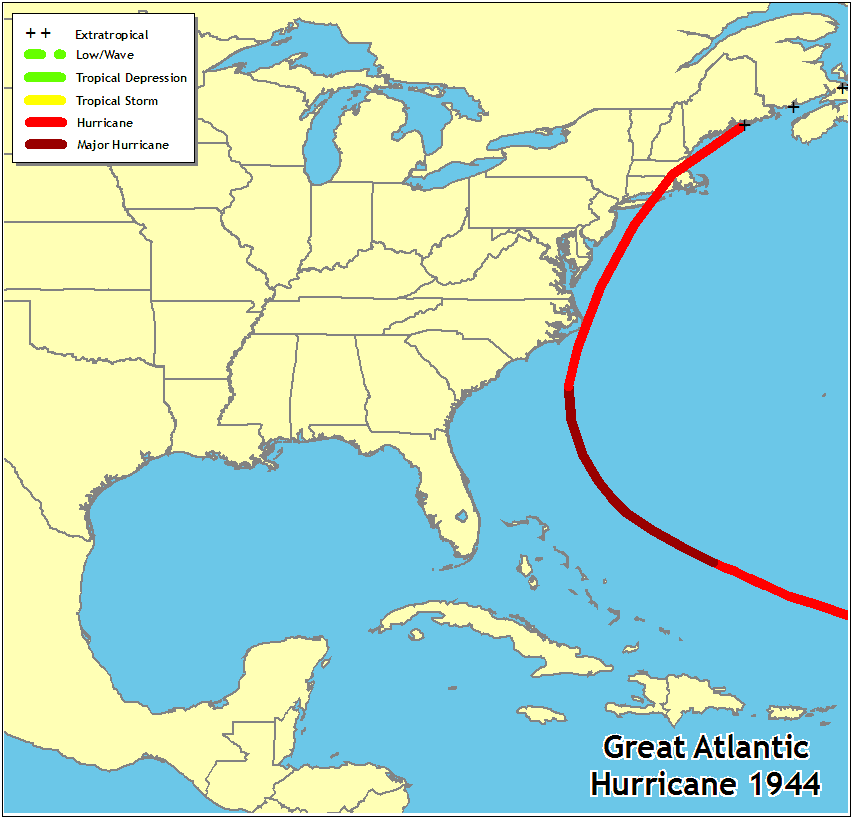
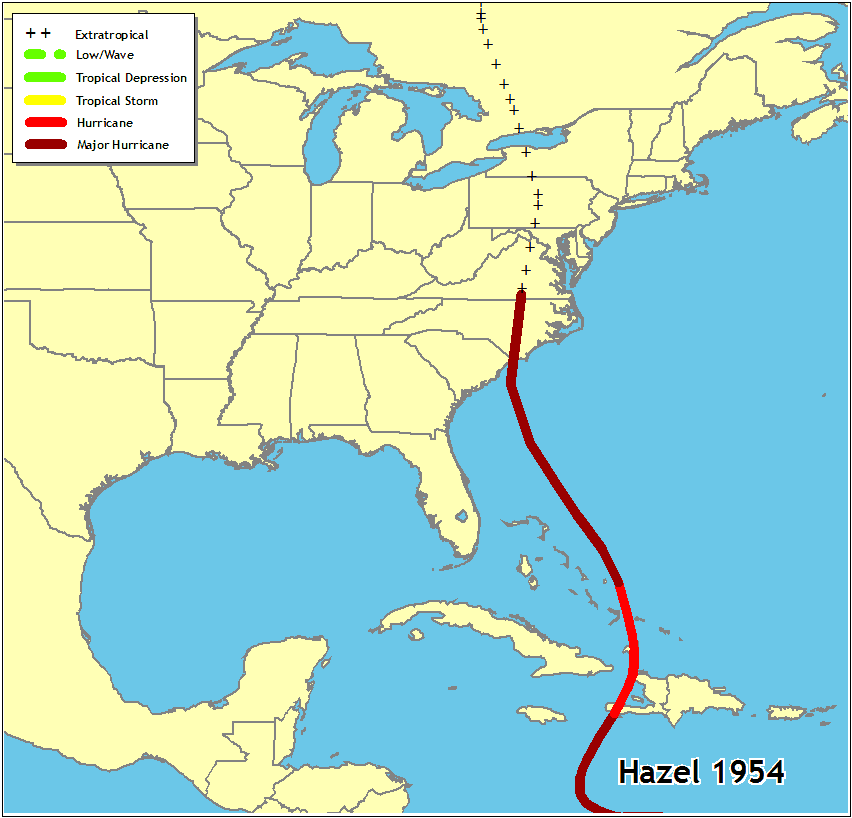
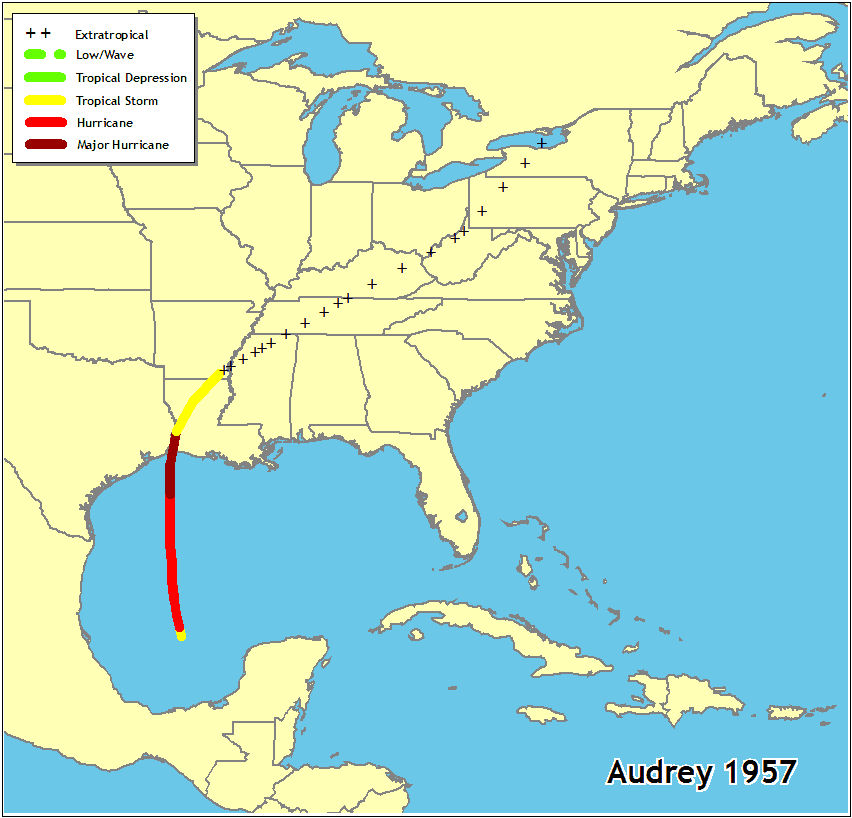
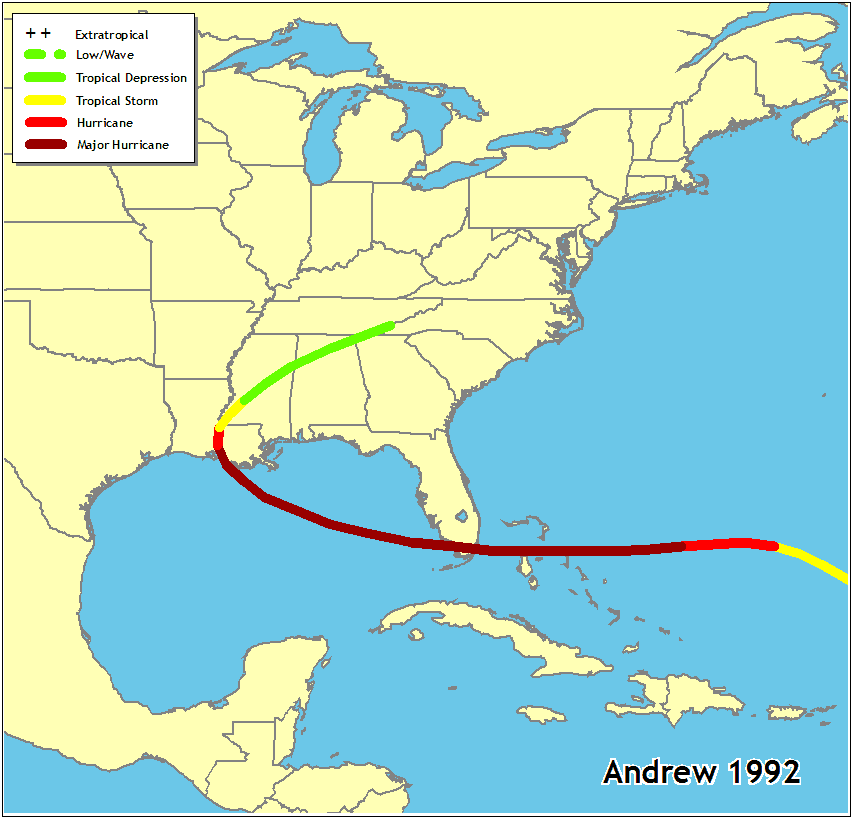
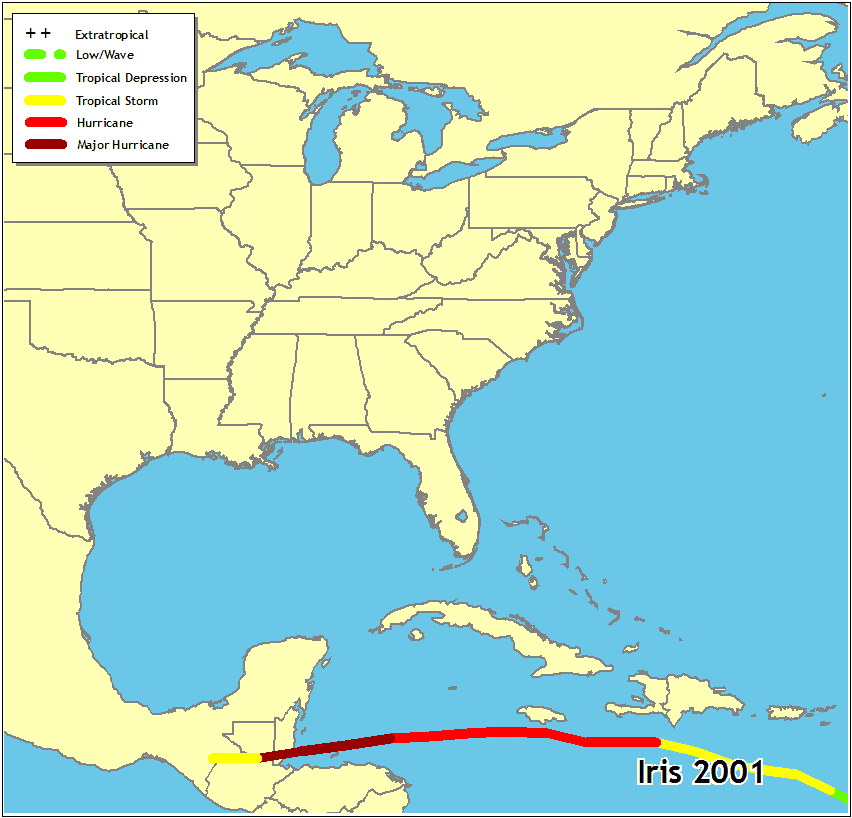
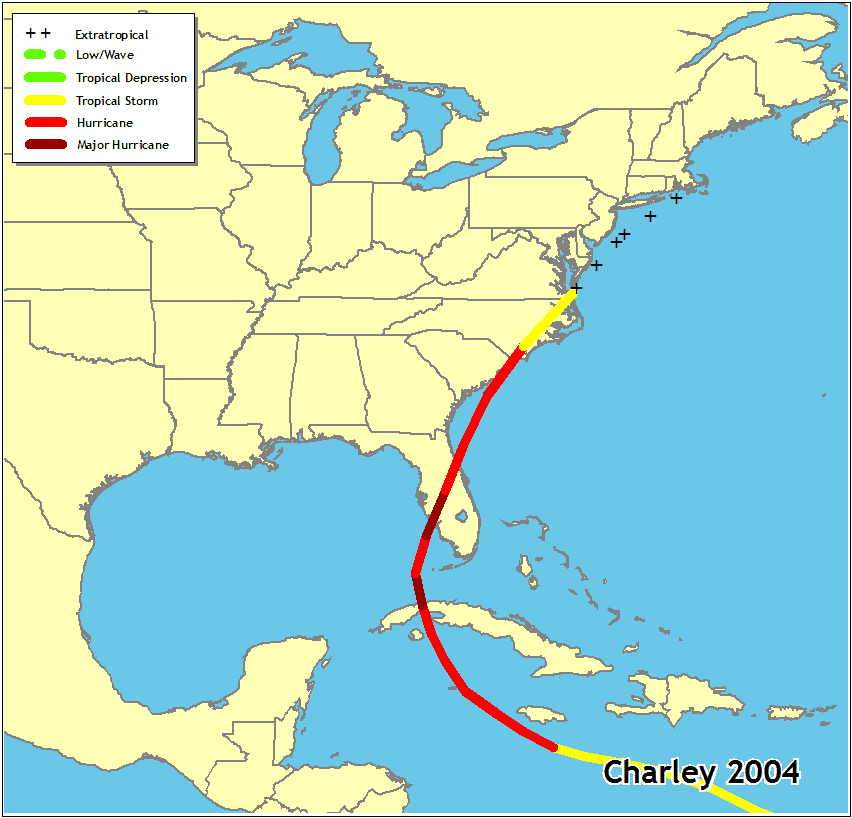
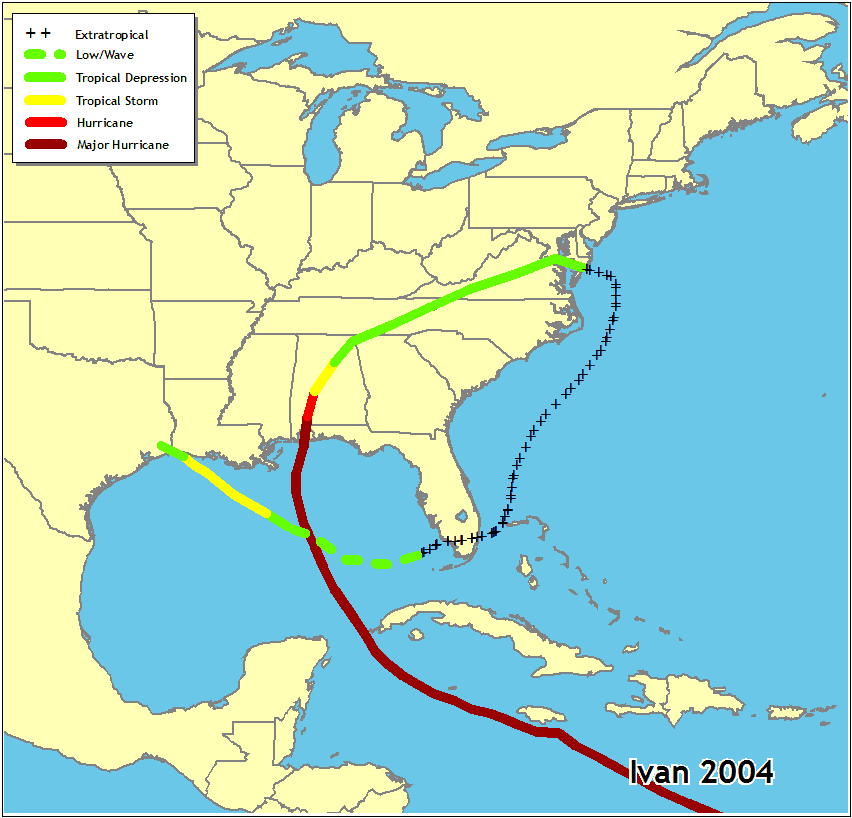
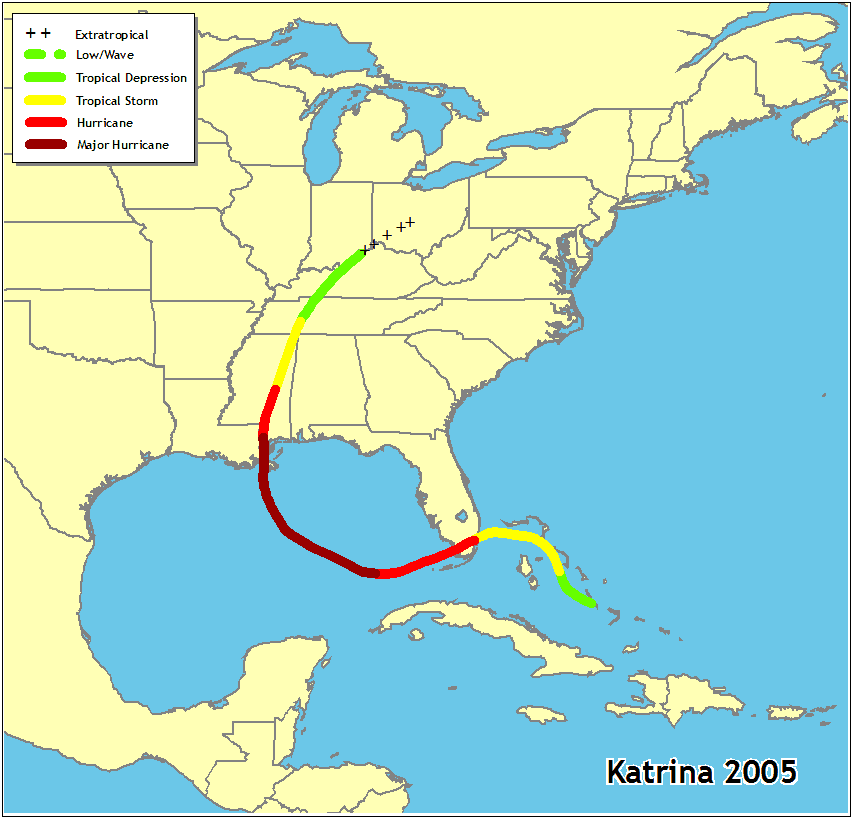
What paths do hurricanes take?
Every storm is different, which makes predicting their behavior so very challenging. But take a look at some historical storms and the path they took as they grew and made landfall.
Click the pictures below to see more detail about these hurricanes, including their name, what year they happened, and how intense they were.
 |
 |
 |
 |
 |
 |
 |
 |
 |
 |
 |
 |
 |
 |
 |
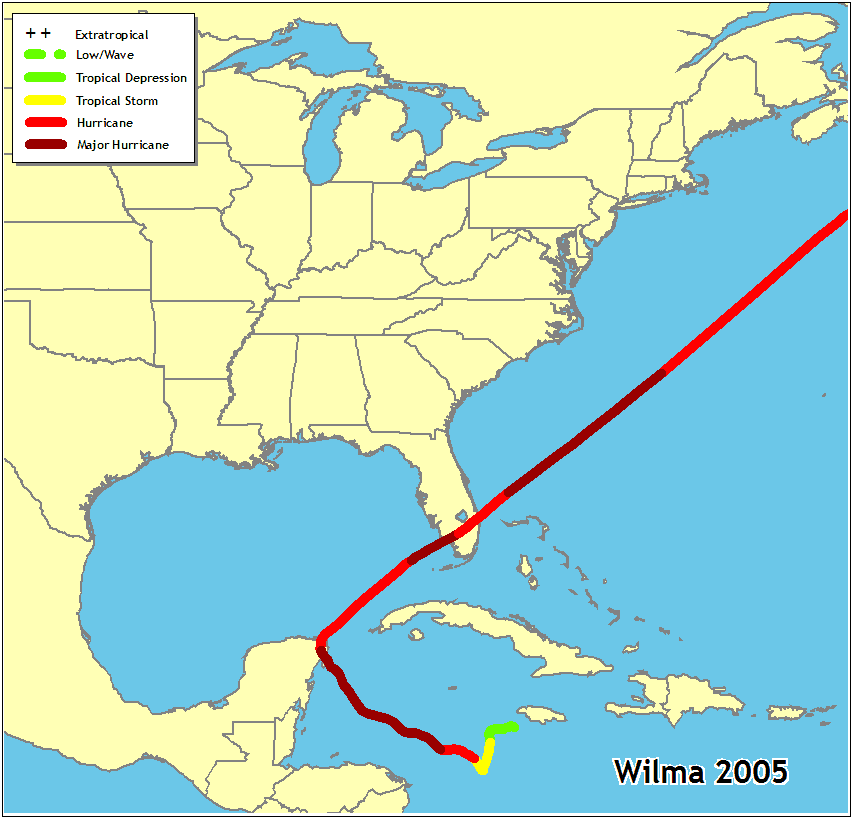 |
All images from the NOAA/ National Weather Service, National Centers for Environmental Prediction, National Hurricane Center