
From devastating storms and destructive wildfires to disruptive solar eruptions and captivating atmospheric phenomena, NOAA’s GOES satellites have seen it all. Since 1975, GOES have been our “eyes in the sky,” keeping constant watch over the Western Hemisphere to warn us of severe weather and hazards while providing breathtaking views of Earth.
To mark 50 years of GOES in orbit, NOAA is looking back at ten notable events captured by these groundbreaking satellites.
Mount St. Helens Eruption (1980)

GOES-3 visible imagery of the eruption of Mount St. Helens on May 18, 1980.
On May 18, 1980, Mount St. Helens in southwestern Washington state erupted after being dormant for 123 years. Shortly after 8:30 a.m. PDT, a powerful earthquake caused a mile-wide portion of the mountain’s north face to collapse. The eruption produced a force equal to 10–50 megatons of TNT and spewed ash 12 to 16 miles into the atmosphere. The event remains the deadliest volcanic eruption in U.S. history.
GOES-3, from its fixed position 22,236 miles above the equator, was the first satellite to observe a major volcanic eruption from geostationary orbit. This relatively new tool (the first GOES launched just 5 years earlier), helped establish the usefulness of GOES satellites for monitoring volcanic activity and other rapidly changing environmental hazards.
GOES-3 provided frequent information about the development and spread of the ash plume, helping to warn pilots and inform emergency managers and public health officials about hazardous ash from the eruption.
“Storm of the Century” (1993)

GOES-7 color-enhanced infrared satellite animation showing the development and progress of the Storm of the Century from March 11–14, 1993.
From March 12-14, 1993, a massive winter storm system with the force of a Category 3 hurricane spawned tornadoes, dropped historic amounts of snow, and caused coastal flooding from the deep South to Canada. Often referred to as the “Storm of the Century,” the storm was one of the largest and worst winter storms in U.S. history.
GOES-7 monitored the explosive development of the storm that started over Texas and intensified over the waters of the Gulf, transitioning into a powerful winter storm system that devastated much of the East Coast. This extreme storm covered more than 550,000 square miles and affected nearly 120 million people.
The satellite tracked the incredible extent of snowfall from Alabama to Maine, with measurable snowfall even in parts of the Florida Panhandle. Mount LeConte, Tennessee, received 56 inches of snow. GOES-7 also monitored the development and progression of a deadly derecho that impacted Florida and Cuba on March 14.
Great Halloween Solar Storms (2003)
The sun unleashed a series of powerful solar storms beginning in late October 2003. Three intense sunspot regions produced 17 solar flares from Oct. 19 to Nov. 5, 2003.
The resulting strong geomagnetic storms caused a blackout in Northern Europe and intermittent disruptions in satellite television and radio services elsewhere. Airlines rerouted planes to avoid the high radiation levels and communication blackout areas. NASA ordered astronauts in the International Space Station to take shelter and more than half of Earth-orbiting satellites experienced anomalies. The solar activity also sent several deep-space missions into safe mode or complete shutdown. It destroyed the Martian Radiation Environment Experiment aboard NASA's Mars Odyssey orbiter.
GOES-12 captured the event with its brand-new Solar X-ray Imager (SXI), the first X-ray telescope to take a full-disk image of the sun. SXI enabled forecasters to better detect solar storms and monitor and predict space weather that could affect Earth.
GOES-13 Watches the Moon (2006)

GOES-13 visible imagery of the moon on July 14, 2006.
Several times per year, GOES satellites capture images of the moon when it is near Earth’s limb, the edge of Earth's atmosphere as viewed from space. But on July 14, 2006, the recently launched GOES-13 observed just the moon, without a view of Earth. This image was taken during post-launch testing of the new satellite to establish a baseline for future measurements.
GOES satellites use the moon for calibration and to monitor the performance of their imaging instruments while they’re in orbit. The moon is a very stable target — it always reflects sunlight the same way. The moon also has no atmosphere so it doesn’t change like Earth’s clouds or land.
Scientists have studied the moon extensively and know how bright it should be at different times. When GOES satellites image the moon, the results are compared to lunar models. If the results are not as expected, engineers can make adjustments to recalibrate the instruments.
Actinoform Clouds in the North Pacific Ocean (2008)

GOES-11 visible imagery of actinoform clouds in the eastern North Pacific on March 29, 2008.
GOES-11 spied actinoform clouds in the eastern North Pacific Ocean on March 29, 2008. These collections of shallow clouds, organized in a distinctive radial pattern, often appear leaf-like or reminiscent of wagon wheel spokes. Their name describes their shape—“actino” is derived from the Greek word for “ray” and the spoke-like structures that reach out in all directions are called “actiniae.”
These cloud formations are so large that it’s not possible to recognize them from below. They were not known to exist until the satellite era. In August 1962, NASA’s Television Infrared Observation Satellite (TIROS) V satellite first observed an actinoform cloud southwest of Hawaii.
Research has linked the clouds to recurring weather patterns in Southern California. These cloud formations are associated with drizzly weather patterns nicknamed May Gray and June Gloom.
Tornado Super Outbreak (2011)

GOES-13 visible imagery showing clusters of severe thunderstorms on April 27, 2011, which spawned several tornadoes.
The April 2011 tornado “super outbreak” was one of the most devastating in the nation’s history. From April 25-28, more than 360 confirmed tornadoes struck 21 states across the southern, midwestern and northeastern U.S., including three EF5s with winds above 200 mph. The tornadoes left at least 340 people dead, killing more people than any tornado outbreak since 1936 when 454 people lost their lives.
During this severe weather outbreak, NOAA operated the GOES-13 satellite in a special “rapid scan” mode, supplying imagery as frequently as every five minutes (compared to every 15 minutes during normal operations). This imagery showed the storms exhibiting several overshooting tops, an indication of a strong storm.
With faster data processing than the previous generation of GOES satellites, GOES-13 could pinpoint the location of severe storms and other weather phenomena with increased accuracy, allowing forecasters to provide timelier warnings to the public.
Hurricane Harvey (2017)
On Aug. 25, 2017, Category 4 Hurricane Harvey struck Rockport, Texas, as the first hurricane to hit the Texas Coast since Celia in 1970. The storm stalled over southeast Texas, dumping more than 50 inches of rain in some areas. Harvey caused catastrophic flooding, displaced more than 30,000 people, damaged or destroyed more than 200,000 homes or businesses, and prompted more than 17,000 rescues. Harvey also claimed the lives of 89 direct victims, the largest number of direct deaths from a tropical cyclone in that state since 1919.
Forecasters had brand-new technology to monitor Harvey — the Advanced Baseline Imager (ABI) onboard NOAA’s GOES-16 satellite, launched just months earlier. As Hurricane Harvey made landfall, National Weather Service (NWS) forecasters in Corpus Christi, Texas, used high-resolution images captured every 30 seconds from GOES-16 in concert with data from their Doppler radar to aid emergency response to the disaster. By tracking the hurricane’s eye in real time, forecasters were able to determine the window of opportunity, as the hurricane eyewall was passing over the region, to evacuate 200 people to safety before the other side of the hurricane eyewall struck.
New NOAA flood maps using ABI data were also critical for response efforts. These maps help officials determine where to employ limited resources during a flood. They also allow for insight into where water is receding. NOAA provides this information to community officials to help them determine, in combination with other critical resources, when it is safe for people to return to their homes. FEMA used the new flood maps during the catastrophic flooding of Hurricane Harvey.
Record-breaking Lightning Flash (2017)

GOES-16 image of the thunderstorm complex that produced the record-breaking megaflash lightning bolt on October 22, 2017.
On Oct. 22, 2017, the Geostationary Lightning Mapper (GLM) onboard the GOES-16 satellite captured the world’s longest lightning flash on record. The bolt traveled an astounding 515 miles, from eastern Texas to near Kansas City, Missouri. This particular flash was not identified in the original 2017 analysis of the thunderstorm, but was discovered through a re-examination in 2025. It is nearly 38 miles longer than the previous record-setting flash that lit up the southern U.S. on April 29, 2020, which was also verified through GOES-16 GLM data.
GLM, the first lightning mapper instrument flown in geostationary orbit, revealed both the intensity and the extent of the megaflash that spawned within a cluster of thunderstorms over the Great Plains. This revolutionary new instrument has increased our understanding of lightning, its relationship to storm intensity, and the duration of lightning flashes as well as the distance they travel. Rapid increases in lightning activity are often observed tens of minutes in advance of severe weather occurring. GLM has given forecasters a new tool to monitor lightning from space, allowing them to focus on intensifying storms before they produce damaging winds, hail or tornadoes.
GLM imagery also clearly shows that lightning can strike the ground at any time during a flash, anywhere along its path. In regions prone to megaflashes, information from GLM can help decision-makers consider when to commence outdoor events and activities following the passage of a strong line of storms.
Meteor Exploding Over Pennsylvania (2022)

The GOES-16 GLM captured a meteor exploding over southwestern Pennsylvania on Jan. 1, 2022. The GLM data is overlaid on ABI imagery from the satellite.
On Jan. 1, 2022, just before 11:30 a.m. EST, reports began coming in (including many emergency calls to 911) about multiple sonic booms heard in southwestern Pennsylvania. The GOES-16 GLM detected the likely source of the sounds — a large meteor exploding in the atmosphere. NWS Pittsburgh posted a GLM image to social media to explain the event, which was used in local, national and international media coverage.
A nearby infrasound station measured the blast wave from the meteor as it broke apart, and the data enabled NASA to estimate the energy was similar to 30 tons of TNT. Had it not been cloudy that morning, the fireball would have been easily visible in the daylight sky; estimates indicate it was about 100 times the brightness of the full moon.
Meteor detection was an unexpected capability from the GLM, which was designed to detect lightning. The instrument takes 500 images of Earth every second, allowing it to measure the shape of a meteor’s light curve, or the change in brightness of a meteor with time, with millisecond precision. GLM can pick up the signals of meteors entering Earth’s atmosphere, as long as they are as bright as a full moon.
Loud “booms” with no visible source can cause a lot of anxiety, especially in populated areas. The NWS and broadcast meteorologists now regularly use GLM data to quickly confirm the source and help calm the fears of the public.
These meteor detections also support national defense. GLM data helps NASA’s Planetary Defense Coordination Office and the Department of Defense better understand and mitigate the threat posed by larger asteroids hitting Earth. GLM data helps improve impact prediction warnings by studying how asteroids fragment as they travel through the atmosphere. This information informs risk assessment models and strategies to deflect potentially dangerous asteroids away from Earth.
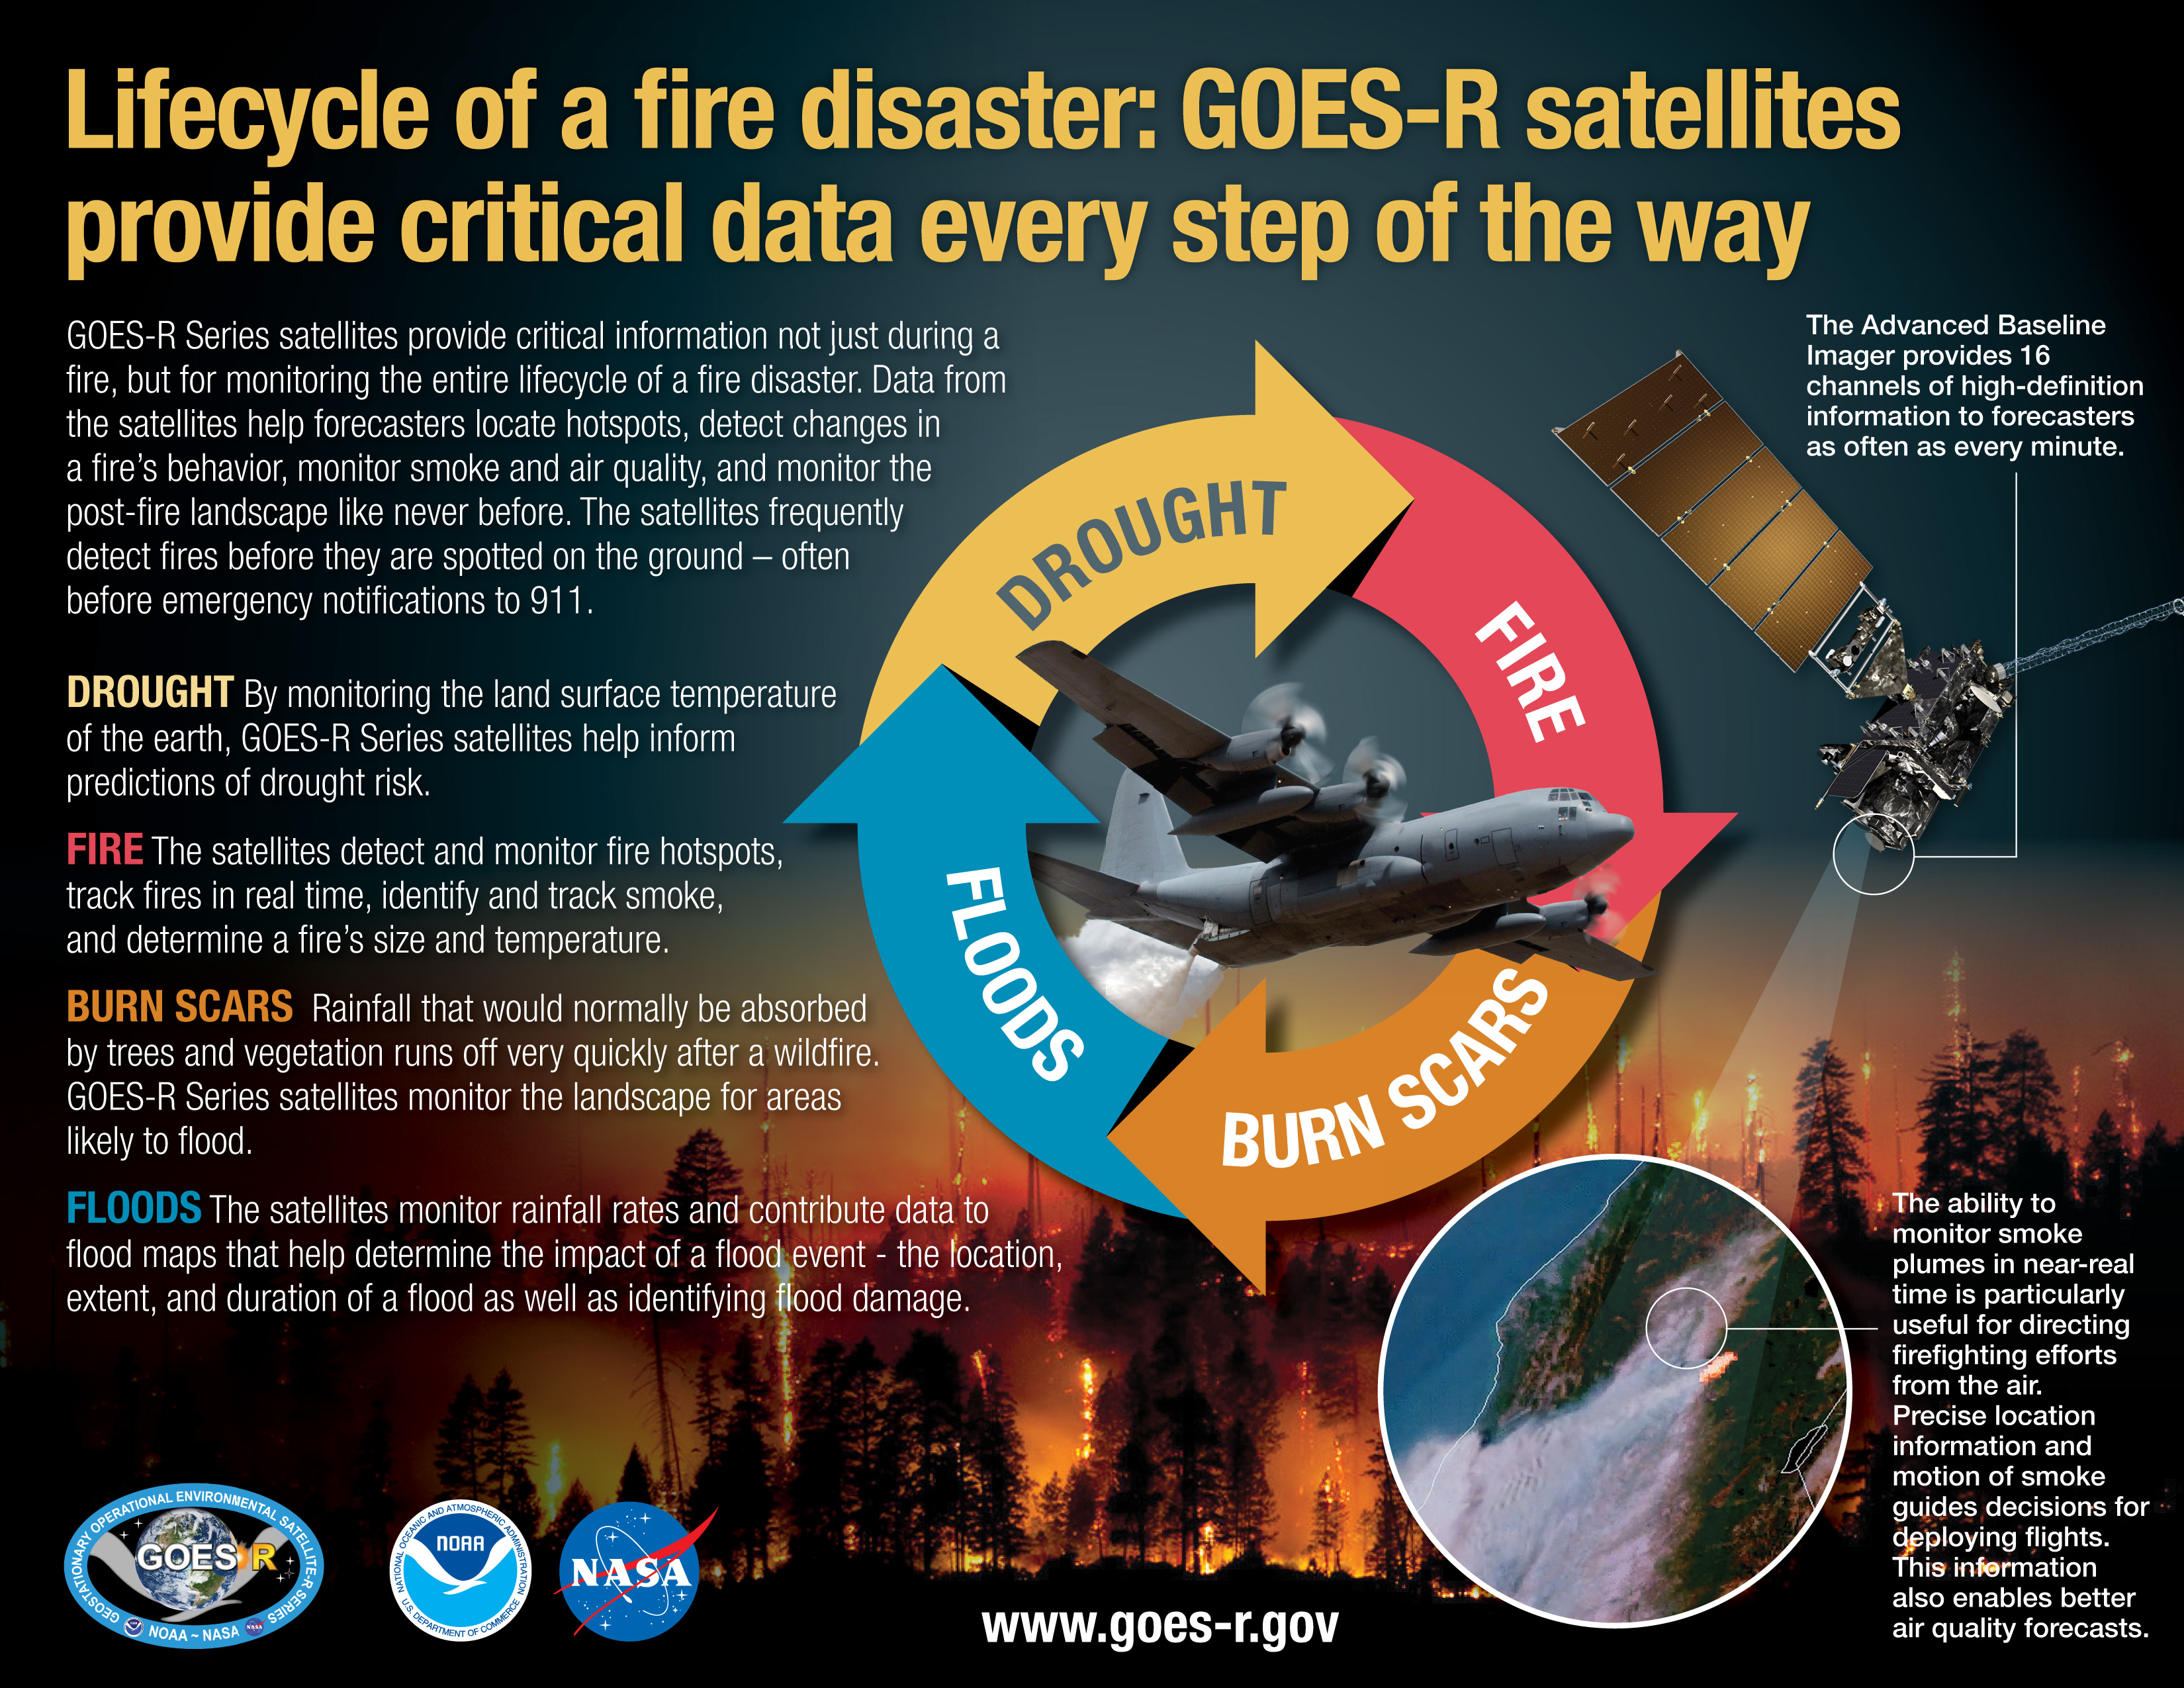
Palisades and Eaton Fires (2025)
Multiple wildfires erupted in the Los Angeles, California, metro area in early January 2025. The first to ignite was the Palisades Fire on Jan. 7. As the Palisades Fire rapidly spread, the Eaton fire broke out shortly afterward, burning 200 acres within an hour. Within days, several other fires had ignited nearby, including the Hurst, Lidia, Kenneth and Sunset fires. The fires raced through densely populated neighborhoods, killing more than two dozen people and destroying more than 15,000 homes. The Eaton and Palisades fires were among the most destructive California fires on record.
GOES-18 water vapor imagery helped NWS provide early warning of the Santa Ana wind event that brought strong winds and dry air to the area, combining with dry vegetation to fuel the fires. During the fires, GOES-18 helped forecasters monitor hotspots, detect changes in fire behavior, estimate fire size and intensity, and monitor smoke and air quality. This information helped local officials and firefighters track conditions in real time to inform decisions on the ground and firefighting efforts from the air.
The GOES-R Series satellites (GOES 16-19) have revolutionized fire detection and monitoring. The satellites often detect fires before they’re spotted on the ground or reported to 911. Forecasters are also using their data in a new AI-powered fire detection system, called the Next Generation Fire System (NGFS). This new tool from NOAA continuously scans GOES ABI data to automatically identify fire hot spots and pinpoint their locations. The system instantly sends out an alert to weather forecasters, fire dispatchers and first responders. Once a fire is detected, NGFS tracks and records the fire’s spread and intensity. This information allows firefighters to respond to a fire before it gets out of control.